First of all, let me introduce roughly what Ganglia is. Ganglia is a scalable distributed monitoring system for high-performance computing systems such as clusters and Grids (taken from http://ganglia.sourceforge.net homepage). So basically it is for people who want to have an idea what their bunch of super-computers are doing as a whole (it monitors nodes as individuals too).
I have been using Ganglia to monitor clusters, but I had it installed on every master node of the clusters, so basically to check how let’s say ClusterX was doing I had to go onto master node’s Ganglia web interface and browse through it, which is not very practical. So I decided to move Ganglia web interface on to a single master node and have different clusters stats separately, but from within a single web interface.
I poked around for an easy way of doing that, but could not find any clear
documentation (I know, my search skills do suck). I was also told on IRC
#ganglia, that I needed separate gmond
processes on the Ganglia master node for every single cluster I wanted to
monitor separately, which kind of made sense, which I obviously tried to
accomplish. So guess what? - It didn’t work (maybe because I have not read
official Ganglia documentationm which is not very detailed anyway IMHO), so I
got totally confused about the way Ganglia works and gathers data from
various nodes.
I thought I will share with you how I got what I originally wanted to achieve.
Ganglia monitoring suite consists of three main parts: gmond, gmetad and
web interface, usually called ganglia-web. Long story short:
-
gmondis a daemon which needs to sit on every single node which needs to be monitored, gather monitoring statistics, send as well as receive the stats to and from within the same multicast or unicast channel -
gmetad- a collector deamon which needs to run on the actualGangliamaster node, normally it goes together with web interface. -
ganglia-web- this component explains itself - it is a bunch of php scripts.
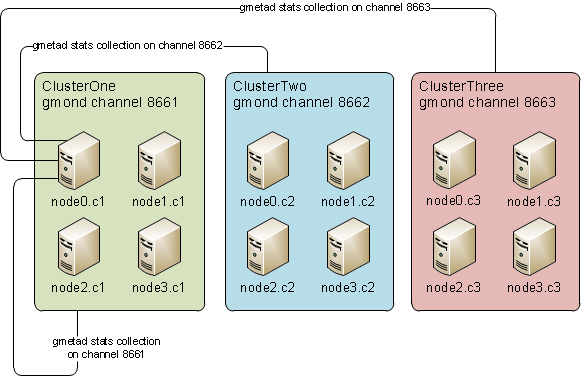
I will not explain how to install Ganglia or how to set up a web server to serve web UI etc - I believe it is very simple. Instead I will try to explain a bit more complex setup. Let’s start from visual stuff - an imaginary setup of one’s network of clusters:
[
As you can see from the diagram above, let’s say we have three clusters on the same broadcast (same network), but instead of having three separate Ganglia web interfaces and gmetad collector daemons we can have one on node0.c1 node, which then can collect stats from three different unicast (in our case) channels.
So what components are needed on what server:
ganglia-gmondis needed on every single nodeganglia-gmetadandganglia-webis needed onnode0.c1only (let’s say we want to dedicatenode0.c1as a Ganglia web interface and stats collector)
And here is the setup snippets of configuration files:
- /etc/gmond.conf identical on ClusterOne nodes (node0, node1, node2, node3) - I will specify the part which is the most important:
# /etc/gmond.conf - on ClusterOne
cluster {
  name = "ClusterOne"
  owner = "unspecified"
  latlong = "unspecified"
  url = "unspecified"
}

udp_send_channel {
  mcast_join = 239.2.11.71
  port = 8661
  ttl = 1
}

udp_recv_channel {
  mcast_join = 239.2.11.71
  port = 8661
  bind = 239.2.11.71
}

tcp_accept_channel {
  port = 8661
}- /etc/gmond.conf identical on ClusterTwo nodes (node0, node1, node2, node3):
# /etc/gmond.conf - on ClusterTwo
cluster {
  name = "ClusterTwo"
  owner = "unspecified"
  latlong = "unspecified"
  url = "unspecified"
}

udp_send_channel {
  mcast_join = 239.2.11.71
  port = 8662
  ttl = 1
}

udp_recv_channel {
  mcast_join = 239.2.11.71
  port = 8662
  bind = 239.2.11.71
}

tcp_accept_channel {
  port = 8662
}- /etc/gmond.conf identical on ClusterThree nodes (node0, node1, node2, node3):
# /etc/gmond.conf - on ClusterThree
cluster {
  name = "ClusterThree"
  owner = "unspecified"
  latlong = "unspecified"
  url = "unspecified"
}

udp_send_channel {
  mcast_join = 239.2.11.71
  port = 8663
  ttl = 1
}

udp_recv_channel {
  mcast_join = 239.2.11.71
  port = 8663
  bind = 239.2.11.71
}

tcp_accept_channel {
  port = 8663
}- /etc/gmetad.conf - only exists on node0.c1 (again the most important part below):
# /etc/gmetad.conf on node0.c1
data_source "ClusterOne" 30 node0.c1:8661 node1.c1:8661
data_source "ClusterTwo" 30 node0.c2:8662 node1.c2:8662
data_source "ClusterThree" 30 node3.c2:8663 node1.c3:8663
Notice, I did not list all the nodes as data sources above for each cluster
(imagine if you had like a thousand nodes per cluster :-) ), the reason why is
it is not necessary. Imagine this as a three different pools, every one of them
has its own virtual boundaries. So what happens is, the gmetad daemon
accesses the configured data sources for data, say if one node dies the other
one will still be able to provide stats to gmetad, because gmond nodes
exchange stats within their configured UDP channels.
Now all you have to do is to configure your web server on node0.c1, start
gmetad (default location for RRDs is /var/lib/ganglia/rrds) and start gmond
services on all the clusters. You should have working monitoring system for
your three clusters on a single node.
If I forgot to mention something or you found some mistakes or lies, please post it in comments, otherwise I hope it will be useful for some people.
